The data you collect in AlisQI yields a ton of value. Although the built-in analytics tools are diverse and powerful, you might have some specific reporting demands AlisQI cannot fulfill. In order to have full control over your analytics and reporting, you can connect Microsoft Power BI to AlisQI. Power BI provides you with interactive visualizations and business intelligence capabilities on top of the AlisQI data.
This article presents a step-by-step example of using the AlisQI data within PowerBI, using the AlisQI API. Once you grasp how this works, you can go nuts and create any report or dashboard you can think of.
Note that PowerBI will only work with the official URL/API AlisQi endpoints, accessible via the Developer Portal.
In this article
Step 1: Define the result set in AlisQI
Navigate to Results overview and create the proper filters to define your data set.
Once that is done, navigate to the API documentation to get the getResults URL.
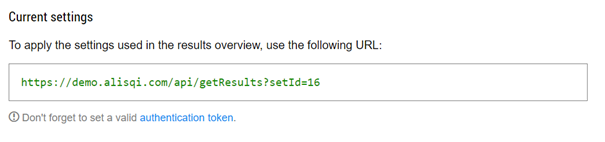
Don't forget to add the authentication token via the access_token URL parameter to the URL, in order to authenticate the Power BI requests.
Step 2: Connecting AlisQI to Power BI
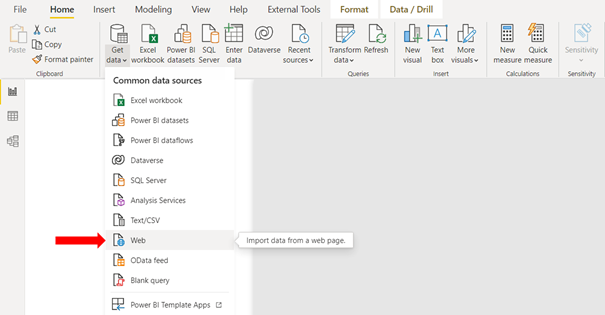
Open up a Power BI report and under the tab Home, click on Get data > Web
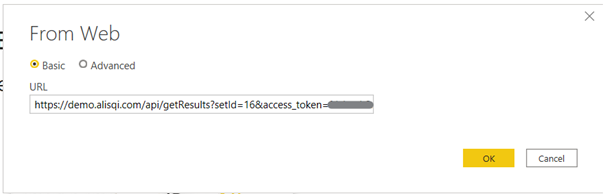
Paste the AlisQI getResults API URL from the previous step in the URL bar and click on OK.
When the connection is successful, Power Query opens and you see your data. Transform the data to your liking and when you’re finished, click on Close & Apply on the top left to load all the data in your Power BI report.
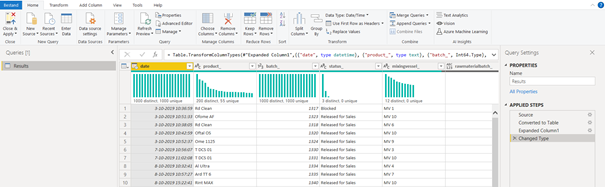
Date and times are sent in UTC; you must transform the date inside PowerBI to suit your locale.
For more information on date/time conversion, read this article.
Step 3: Visualize your data
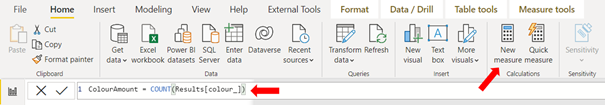
Now you have this data, you can start visualizing it. Imagine that you want to see the number of distinct colors in your data. In order to see this, you need to create a measure. Under the Home tab, click on New measure and use DAX to write it. In this example we are using a very simple measure:
ColourAmount = COUNT(Results[colour_])
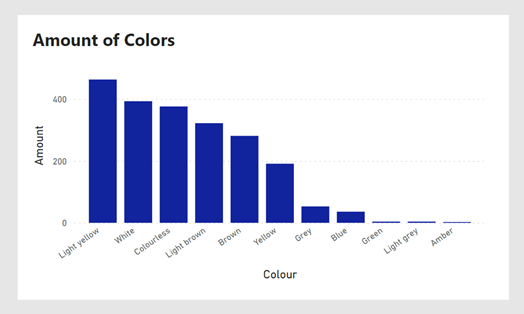
In the report, click on a visual you want to create. In this example, we choose the Stacked Column Chart.
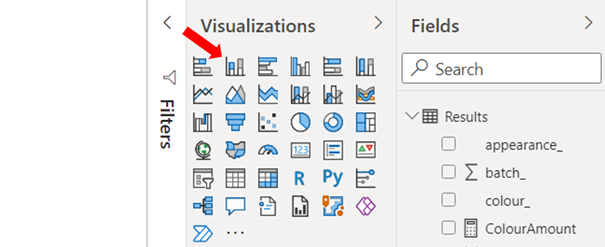
Drag the newly created measure in the Values field and the colour_ column in the Axis field and voila, you now have created your first Power BI visual from AlisQI data!
Embed PowerBI dashboards in AlisQI
After you created your insightful PowerBi dashboards, you want to make them available to your team. As AlisQI is your one-stop-shop for all quality information and documentation, it makes sense to include your custom quality dashboards within AlisQI. To enable this, we enabled PowerBI dashboard embedding.
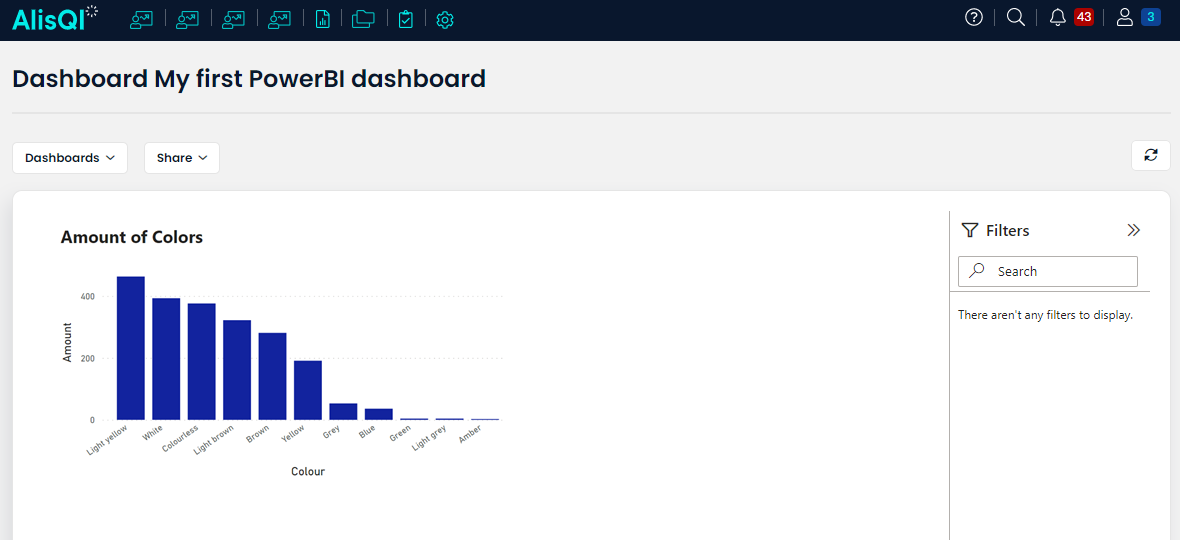
Read all about embedding your PowerBi dashboards in AlisQI here.
A valid Power BI license is required to integrate AlisQI with Power BI.
This license enables access to Power BI’s data connectivity and reporting capabilities necessary for the integration. API access to all AlisQI data is included with your AlisQI license, so no additional AlisQI costs apply for integration purposes.