Without the proper tools, data analysis is a bit like drinking water from a fire hydrant. The experience can be overwhelming and, in the end, leave you feeling unsatisfied. That's why quality dashboards are vital for manufacturers. They funnel and filter a continuous flow of data into panels that display visual snapshots, clear metrics, and KPIs.
This article shows you how to create and customize quality dashboards that display easy-to-access actionable data.
In this article
All dashboards refresh every five minutes, so the data you see is always up to date.
Introduction
Let's start with a short video on dashboards in AlisQI.
Manage dashboards
To open the Dashboard screen, go to Reporting » Dashboard.
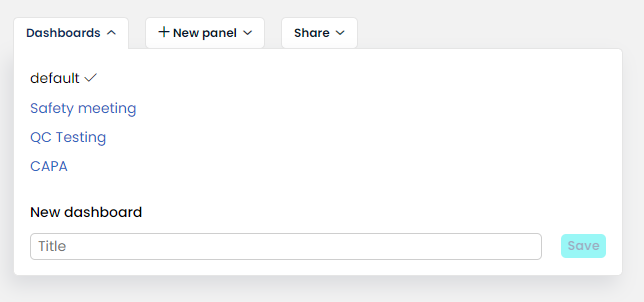
This displays a list of the current dashboards and the Default dash. Every user account has one default dashboard. You can create as many dashboards as you need.
- To create a new dashboard, enter a unique name in the title section and click Save.
- To rename a dashboard click on the edit icon
- To delete a dashboard, click the trash can icon.
Add panels
A dashboard is a collection of panels that provide access to quality information. Manufacturers have full flexibility in what metrics to add to their dashboards so that they can act promptly and work more efficiently. The dashboards refresh every five minutes, so the data you see is always up to date.
You can add panels to your dashboard from:
- the Dashboard screen
- a results or statistics overview
- a control chart or SPC overview
- a distribution chart
From the dashboard screen
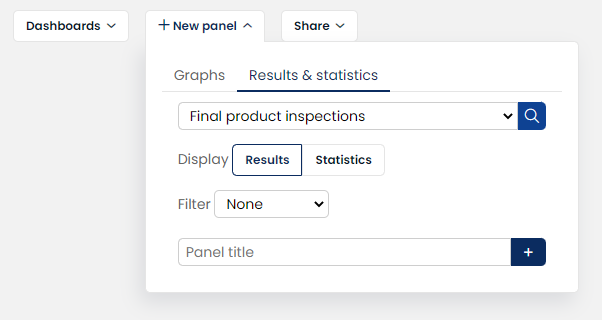
Go to the Dashboard screen and click the +New panel button. From here, you can create a panel from a stored graph or a data set (with saved filters) on the Results & statistics drop-down menu. The Results and Statistics buttons allow for even further tailoring of how your data will be displayed.
From a results or statistics overview
You can also add panels to your Dashboard from the graphs, statistical overviews, and result overviews. Reporting » Add to Dashboard
A (filtered) results overview and statistics overview can be added through: Reporting » Add to Dashboard
From a chart
A control chart and SPC overview can be added through Save » Add to DashboardYou can add a distribution chart directly from the pop-up by clicking on the "Add to Dashboard" button in the chart's panel footer.
The number of panels per dashboard is limited to 50, to safeguard usability and technical performance.
Changing dashboard layout
In order to present the data as clear and easy as possible, you can customize what type of information you’d like to bring to the forefront but also how this information is presented. Prioritize panels with pressing issues, remove those that are no longer needed and easily share dashboards.
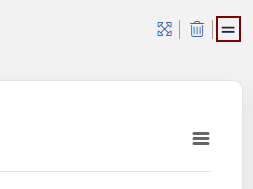
To change the width of a dashboard panel:
- Hover the mouse on the top right corner of a panel.
- Click the toggle icon. The panel width toggles between half-screen and full-screen.
If you decrease the width of multiple panels, it's possible to create a side-by-side display on the screen.
Moving panels
To change the position of a dashboard panel, click the title and drag it to a new location. When you drop, the dashboard layout will update. The changes are stored automatically.
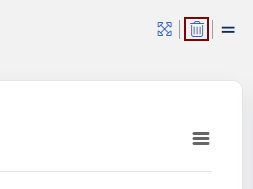
Removing panels
- Hover the mouse on the top right corner of a panel.
- Click the trash can icon and then OK in the confirmation pop-up window.
Embed PowerBI dashboards
To leverage the power of combining data from AlisQI and other data sources, you can connect external Business Intelligence tools like PowerBI, Qlic or Tableau. By means of the AlisQI API all master and transactional data is available for reporting. This includes both raw data and aggregated data. This allows you to create custom dashboards as much as you like. Your external BI dashboards can be embedded in AlisQI, so that you can create your one stop shop for all quality documentation, information, aggregation and reporting.
Read all about connecting AlisQI with PowerBI here.
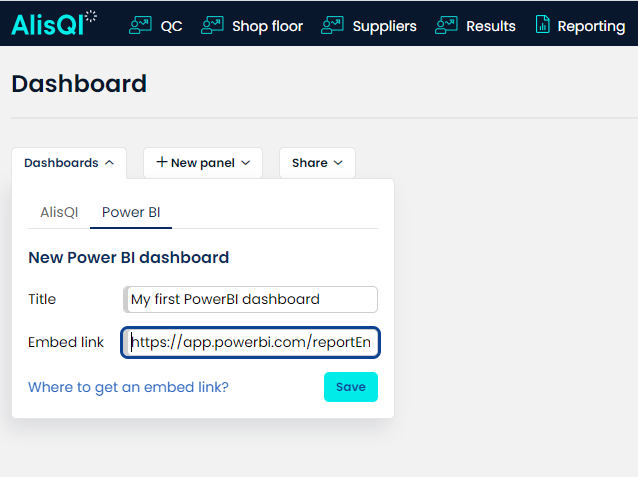
Create a new PowerBI dashboard in AlisQI using the PowerBI tab in the Dashboard settings. Paste the embed link in the input and you're done.
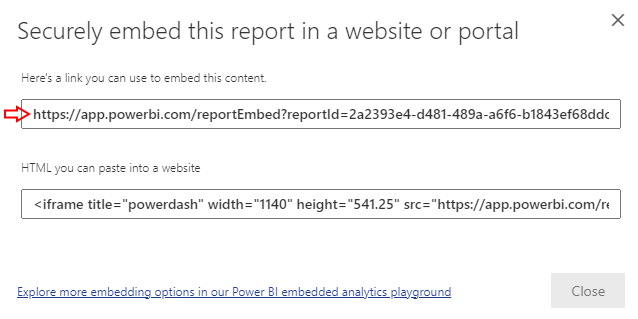
Step 1: Copy the embed link from PowerBI
Step 2: Paste the embed link in your AlisQI dashboard
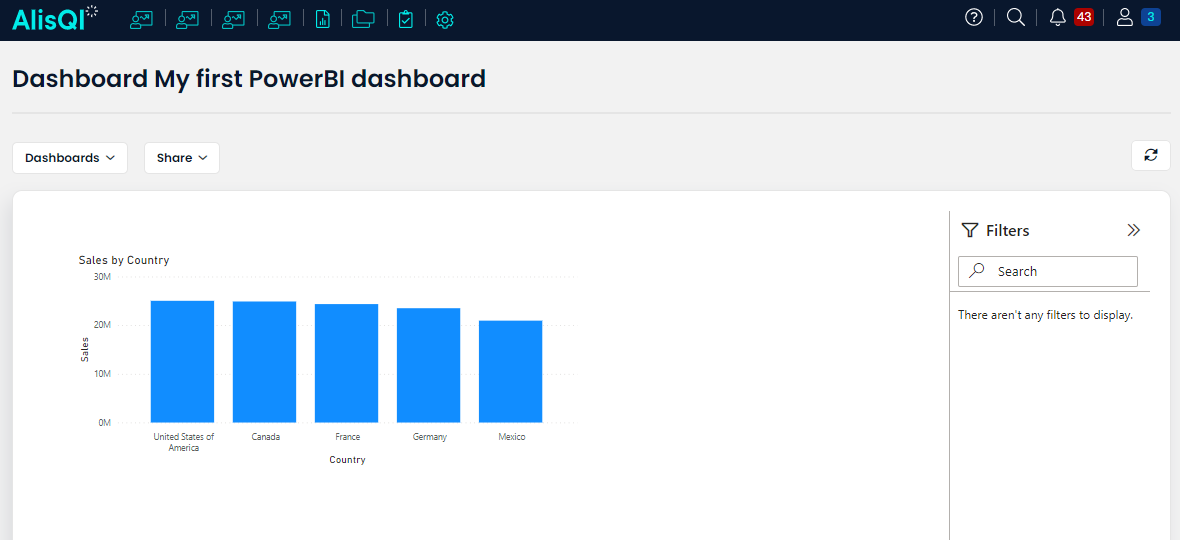
That's all. Now your PowerBI Dashboard will be loaded within AlisQI, similar to your other dashboards.
Sharing dashboards
On the Dashboard screen, click the Share button and choose from the drop-down menu to select a username. The selected user receives an instance of the dashboard by email.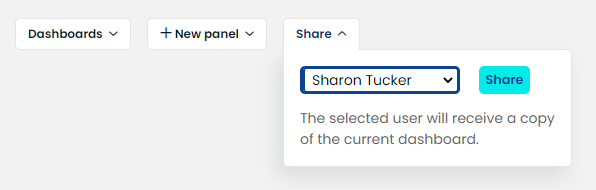
A dashboard is shared by making a copy of the dashboard. After this initial share, there is no synchronization. This means that changes to the original dashboard are not synchronized to its copies.
Example applications
Quality dashboards are a powerful building block in our platform. They enable you to quickly get a helicopter view of your operation, improve awareness and facilitate real-time communication between departments.
We created a shortlist of example dashboard applications and their configurations. It's hardly complete. We aim to show you how AlisQI dashboards can help you make quality management smart and omnipresent.
- Use dashboards to guide meetings
In your quality operation, you probably have a number of regular meetings, like a monthly safety meeting or a weekly improvement group meeting.
These meetings often start with a review of the performance in the last period. We see many of our customers creating dashboards for these meetings to provide all the data with a click of the mouse. This eliminates the data collection and reporting task so that you can spend your time on the actual improvement projects. - Real-time production dashboards
Awareness is key in quality management. Visualizing your performance, by means of a control chart, for example, will boost the awareness regarding deviations.
Imagine these dashboards on large screens on the shop floor. This can be a valuable first step in improving quality. - Personal dashboards for your start of the day
As a production manager, you probably want to check a number of statistics first thing in the morning, to understand how yesterday's performance was. Instead of going through stacks of paper or numerous Excel files, do yourself a favor and create a personal dashboard.
Grab a coffee and review your data. How's that for the start of your day?