This feature is available with an active subscription to this solver:
Open SPC Overview
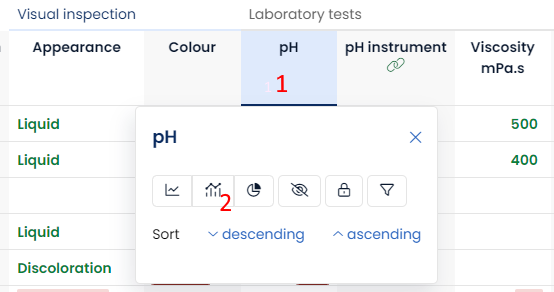
From the Results overview you click on the column title (1) to open the SPC overview (2). The SPC overview is available for all numeric fields in an analysis set. You can add numeric fields with the Form Editor.
SPC tools built-in
There are a number of statistical tools and indicators included in the SPC overview. In this article, we discuss the following:
Our specification evaluation also provides much of the information shown here, but for all measurements instead of just one.
Normality testing
The Statistical Process Control we apply proceeds from the assumption of a normally distributed data set. In order to validate whether your data set has this normal distribution, AlisQI provides a basic validation based on Skewness and Kurtosis.
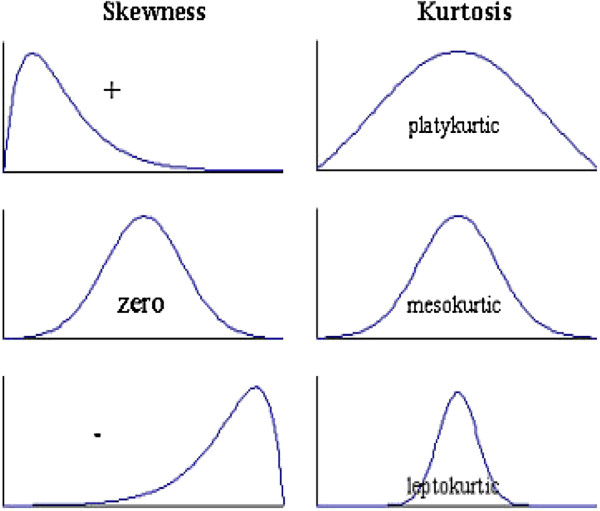
Skewness
Skewness is a measure of symmetry, or more precisely, lack of symmetry. A distribution, or data set, is symmetric if it looks the same on the left and on the right side of the center point.
Kurtosis
Kurtosis is a measure of whether the data are heavy-tailed or light-tailed relative to a normal distribution. That is, data sets with high kurtosis tend to have heavy tails or outliers. Data sets with low kurtosis tend to have light tails or a lack of outliers. A uniform distribution would be the extreme case.
Distribution
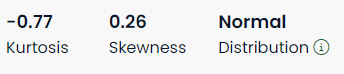
Values for skewness and kurtosis between -2 and +2 are considered acceptable in order to prove normal univariate distribution (George & Mallery, 2010).
AlisQI indicates whether the data depart from the normal distribution. This is done by comparing the data's skewness and kurtosis with +/- 2x the standard error of skewness and kurtosis. If the values fall outside these ranges, it is considered as departed from the normal distribution.
QQ plot
Additionally, a QQ-plot is presented to visually evaluate the distribution. In brief, for normally distributed data, observations should lie approximately on a straight line. If the data is non-normal, the points form a curve that deviates markedly from a straight line. Possible outliers are points at the ends of the line, distance from the bulk of the observations.
Standard deviation
The standard deviation tells us how constant the values of a dataset are. Hover over the text to see the control limits.
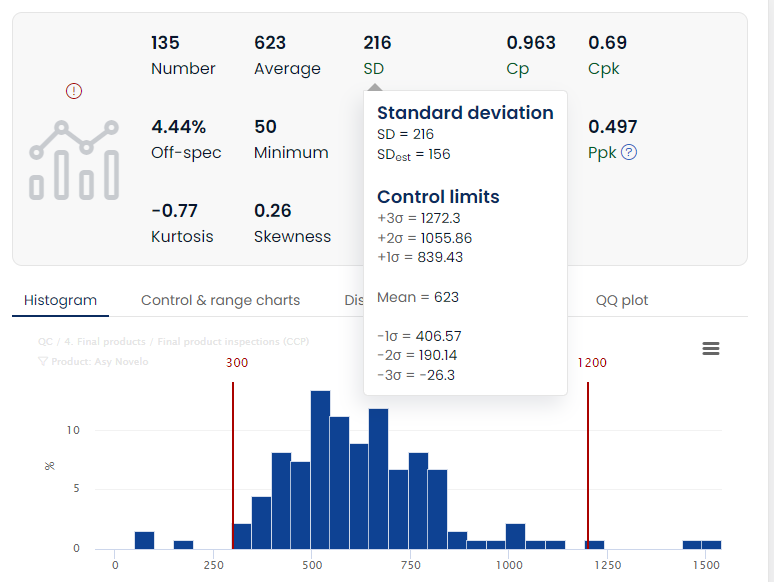
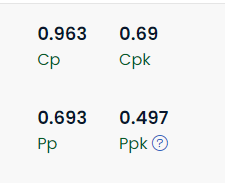
Process capability
In order to assess the capability of your process, meaning how capable you are of producing with your specifications, you can use the Cp, Cpk, Pp, Ppk indicators. These indicators essentially present the ratio between specs and 3 standard deviation control limits. Please read the article Process Capability & Performance.
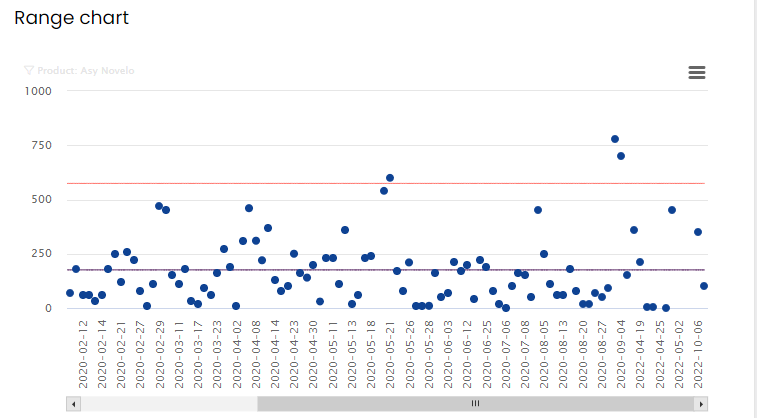
Range chart
A range chart is used to measure the spread in your datapoints.
Please consider the following example: In a continuous production process samples are taken at certain time intervals. Each sample point in time gives rise to 5 separate samples to measure for the weight. Based on the average over these 5 subsamples, the specifications are checked and the sample is validated. However, the average does not give you the full answer as the individual samples could be spread out. The range of such a sample can then be calculated by subtracting the lowest value from the highest value. The obtained range is an estimate for variation, it gives you the spread of the datapoints of that particular sample point.
Calculate the range
AlisQI calculates the standard range chart based on individual values. For each datapoint in the range chart the value from the ‘previous’ record is subtracted from the ‘current’ value. For n measurements this gives n-1 datapoints in the range chart.