Control charts play a very important role in Statistical Process Control. The control chart is a graph used to study how a process changes over time. Data in the control chart are plotted in time order.
In AlisQI, control charts are available for any numeric field. This includes fields that are inputted manually, automatically, or result from a calculation.
This feature is available with an active subscription to this solver:
In this article
Introduction
Let's start with a two minutes introduction of the AlisQI quality control capabilities.
Open a control chart
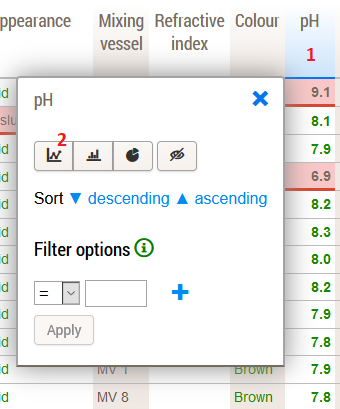
Control charts contain data for one particular field in an analysis set. You open a control chart from the column header tools in the Results overview (1).
Any filter applied to your results overview will be included in the control chart. This enables you to zoom into specific subsets of data.
Display options
The control chart window has quite a few tricks up its sleeve. By means of the Toolbar » Display settings, you can:
- Choose between a line or dots chart type
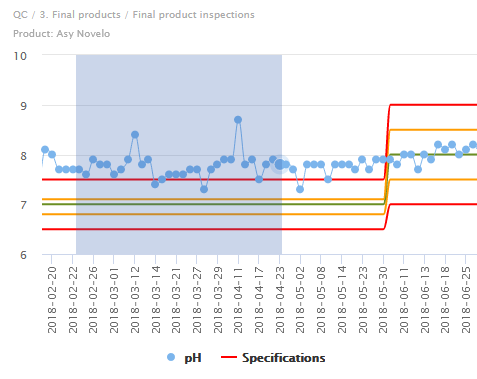
- Show specification limits
This defaults to Yes for fields that have a specification - Show control limits
The control limits are calculated as 1,2,3 times the standard deviation (σ) above and below the average. - Show a trend line
Choose between none, linear, average, and developing average - Define the x-axis value
- Set a range for the y-axis
Out of control detection
When you have an SPC rule set activated, you can use those rules to search for undesired patterns in your data.
When you click on the SPC patterns button in the toolbar, the system will start to analyze the dataset and report all patterns it finds. By clicking on a panel you will see the pattern highlighted in the chart.
Zooming and context
You can zoom in to your chart by selecting a range of interest.
By clicking on a value in the chart, a popup with the full context of that value appears.
Dashboards
Just as with any other chart, control charts can be added to dashboards. Do so by clicking Toolbar » Save and then selecting the Dashboard you want to add this control chart to. This way, you can surface pressing issues and improve access to quality information.