The holy grail for any manufacturing manager is a fully capable process. Meaning that your factory does what it should do: produce products your customers want to pay for.
Measuring this capability is not too complicated in itself. All you need is your upper and lower specification limits, your process mean and your standard deviation. And that very last metric, the standard deviation, is what complicates it all.
This articles presents the math behind the capability indicators and standard deviationin AlisQI.
In this article
Process capability and performance indicators
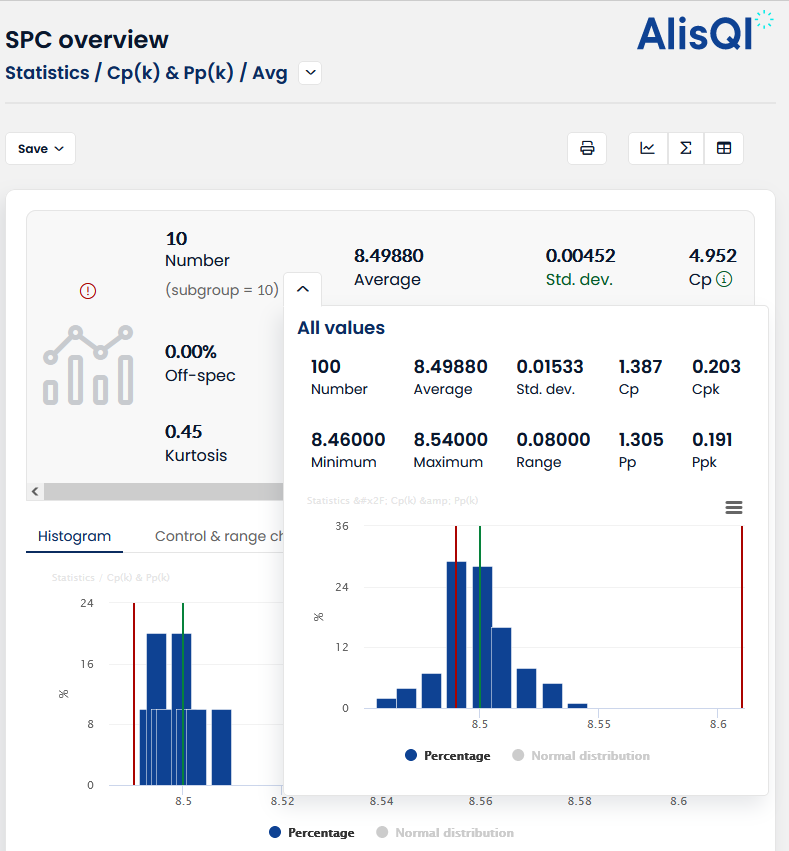
Process capability is the degree to which a process can repeatedly produce parts or products that meet the required specifications. A capable process will produce products that comply with the specifications. The capability index is a measure to show how capable the process is. In that sense, the capability index can be considered as a sort of forecast telling us what we can expect from a process.
Process capability metrics are the Cp and Cpk.
Process performance is very similar to capability. Where capability is more like a forecast, the performance evaluation looks in the rearview mirror of the process, evaluating real historical data.
Process performance metrics are the Pp and Ppk.
Calculations
Both set of metrics use the same calculation:
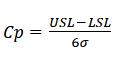
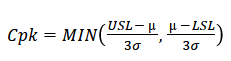
Process capability
Process performance
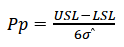

Where
- USL = Upper Specification Limit
- LSL = Lower Specification Limit
- µ = Process mean
- σ = Sample standard deviation
- σ̂ = Estimated standard deviation
These process capability and process performance metrics are very similar. At first glance, the calculation seems identical. However, there is a significant difference to them, and that is how the standard deviation is computed.
Standard deviation calculations
For process capability we use the Estimated standard deviation (σ̂), for process performance we use the sample standard deviation (σ).
Now that we've distinguished them, we want to see how to compute these two standard deviations.
Sample standard deviation
The sample standard deviation is plain simple. That would be the AlisQI equivalent of your STDEV.S() Excel function.
Estimated standard deviation
For the estimated standard deviation, the calculations are slightly more complicated. This depends on your sampling process, or more specially, on your subgroup size. Read more about subgroups here.
For subgroups of size 1 and 2, we use the R bar method:
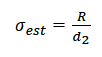
Where
- R = Average range
- d2 = 1.128 (constant)
For subgroup sizes of >2 we use the Pooled Standard deviation method, to accommodate for variations in the subgroup size. In your sampling you might have a standard subgroup size of 5, but sometimes you are only able to process 3 measurements. This variation is what the pooling solves for us.
Mathematically, this is defined as:
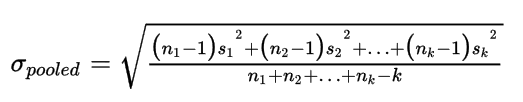
Where
- nx = the number of sample in each subgroup
- sk = the subgroup standard deviation
- k = the total number of subgroups
In words: This weighs the standard deviation by the subgroup size. This means that a standard deviation for a subgroup with five samples has more weight than a standard deviation of a subgroup with only 3 subgroups.
Subgroups
A subgroup is a group of units that are created under the same set of conditions. Subgroups (or rational subgroups) represent a "snapshot" of the process. Therefore, the measurements within a subgroup must be taken close together in time but still be independent of each other.
For example, a die-cut machine produces 100 plastic parts per hour. The quality engineer measures five randomly selected parts every hour. Each sample of five parts is a subgroup.
How many subgroups should I have?
Choose subgroups so that differences between measurements within the same subgroup are small and so that you can detect differences between subgroups. For initial process studies, subgroups of 4 or 5 units that are collected every hour or so are common. As the process demonstrates stability (or as improvements are made), you can decrease the subgroup size and frequency.
Collect subgroups for a duration that is long enough to ensure that major sources of variation have the chance to occur. Usually, 100 observations or more (for example 25 subgroups with 4 observations each) is enough.
Usually, the industry prefers small, frequent samples to signal a process shift before too much defective product is made.
How to manage subgroups in AlisQI?
Assume you have to do observations of a particular characteristic every hour.
In your AlisQI analysis-set, you would then add 5 fields to input each observation. Additionally, you add a calculation to calculate the average of these 5 observations
AVERAGE(field1, field2, field3, field4, field5)
AlisQI recognizes the subgroup size from the AVERAGE calculation and will apply the proper statistical constants defined for the particular subgroup size.
Additionally, you can create an SPC overview on both the averaged values, as well as the combination of the individual observations.