Modern-day technology makes it very easy to generate a lot of data. The primary challenge for quality workers these days is to process all that data into meaning full insights that help you to improve products and processes. That is what AlisQI helps you with. All data managed in AlisQI can be analyzed by means of charts and statistics. This article discusses the Statistics Overview feature.
In this article
To open a statistics overview simply go to a results overview, click on Toolbar » Reporting » Statistics.
You can analyze a subset of your data by applying a filter to the results overview before clicking the Statistics link.
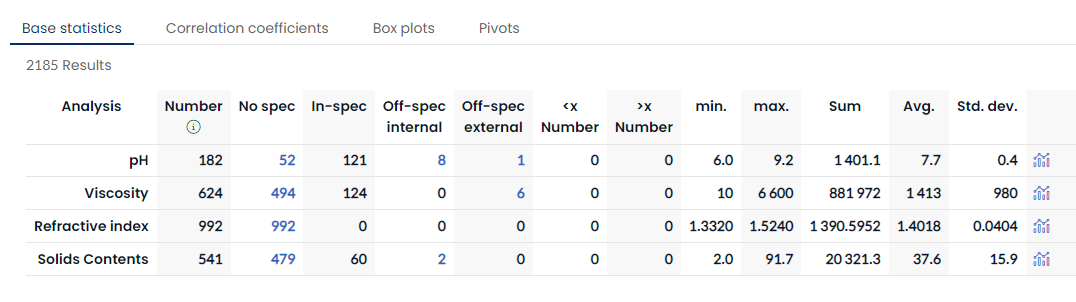
Base statistics
The base statistics tab can be used for every numeric field in the analysis set. This includes the number of off-specs, average, and standard deviation.
Click on the Off specs number to zoom in to those results in the results overview.
Click on the chart icon to get the SPC overview.
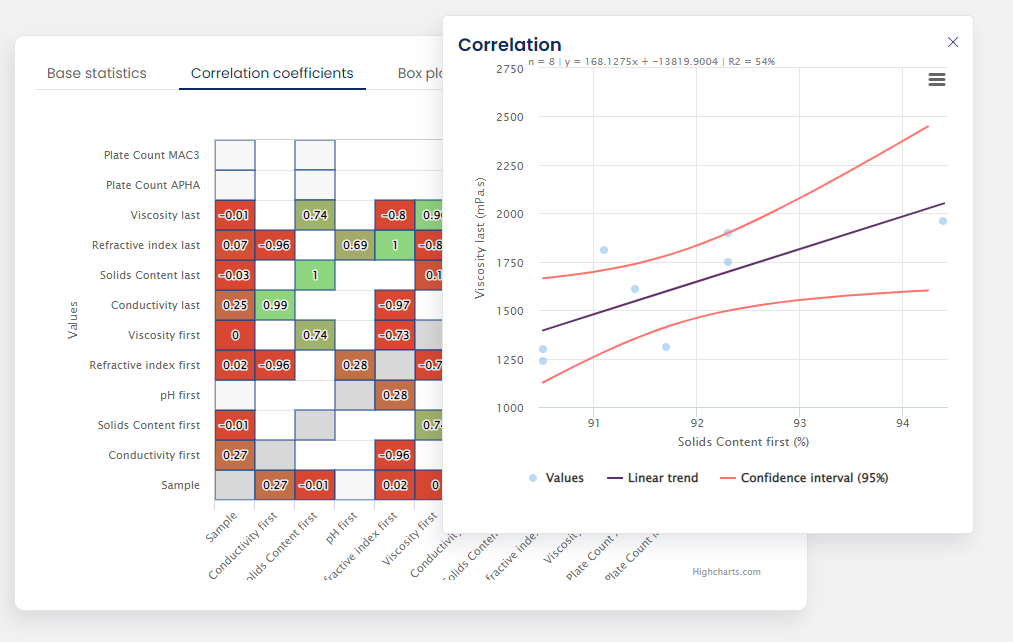
Correlation coefficients
This tab shows you the correlation between all numeric fields. Click on a cell to see a detailed scatter plot.
The regression line and formula are automatically calculated.
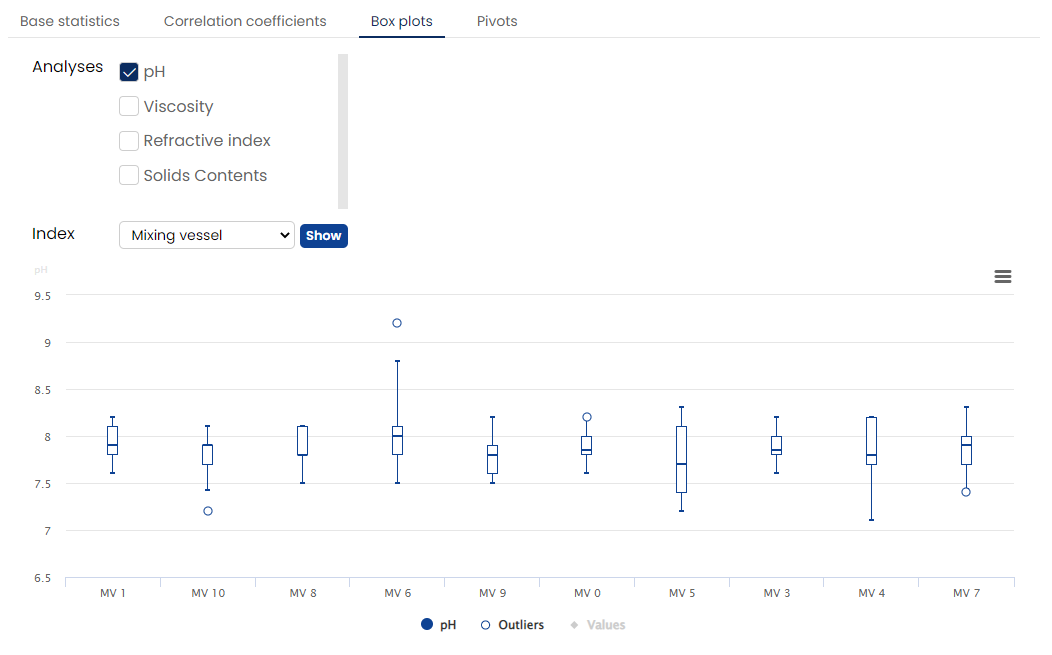
Box plots
This tab lets you create box plots for fields in your analysis set. The Boxplot represents the five-number summary of a dataset.
Select the fields to show as boxplots, and (optionally) an index. This index defined how to group data. You typically want to group data per product, machine, or production line. When you apply an index, only index field options with at least 5 values will be included in the boxplot.
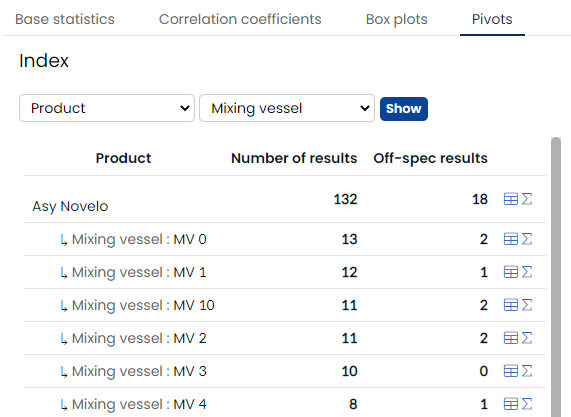
Pivots
Use the pivots to see the number of results and off-specs per option of a selection list. This segments all data by one or two selection lists in the analysis set.
The example below shows the results per Product per Mixing vessel.